
Trading News

To make their
work in the financial market easier and minimize the number of wrong decisions,
traders use technical analysis indicators. One of the most common and
significant in the industry is a tool called the Fibonacci levels. With its help,
you can predict a price retracement.
Experts say
that in order to make technical indicators work, you need to learn how they
really work and find one-size-fits-all formulas for combining them. As for the Fibonacci
levels, many books and tutorials have been written about this indicator, but to
get started with it, all you need to do is understand a few rules, namely:
Learning
how to set up the levels correctly
Despite an immense
amount of information on this indicator, it is, in fact, extremely difficult to
find a clear-cut algorithm for setting up the tool, although in practice even novice
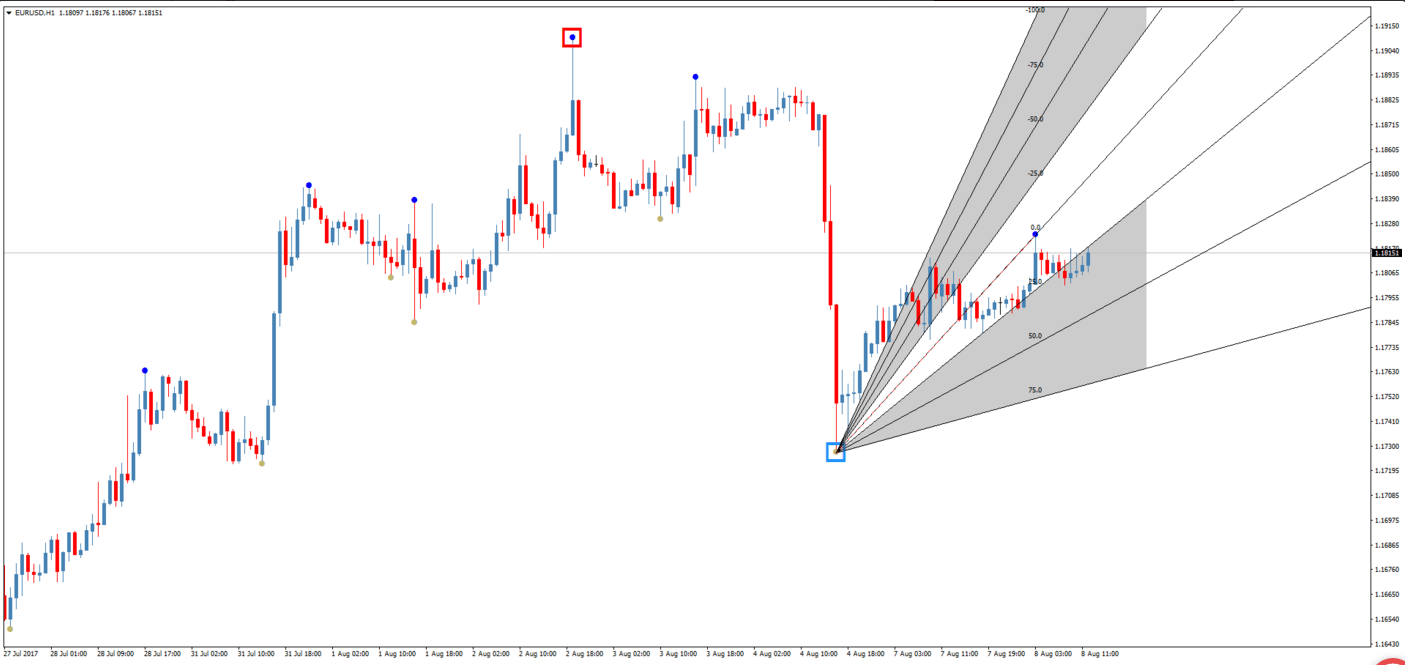
traders can cope with the task. You can set up the levels in just a few clicks:
- find the minimum point on the trend line and hold down the mouse button;
- without releasing the key, move the cursor to the maximum level where, in your opinion, there may be a retracement or reversal.
Please note!
In the event of a downward movement, you need
to select the maximum point and draw a line to the minimum one. If the price
reaches a new maximum, the grid has to be dragged along, and the minimum point
will not need to be changed.
When
to use the Fibonacci levels
In order to
understand when to use this indicator and what it can help you with, you may
wish to consider a simple example. Suppose that you see a trend on the chart
that is constantly moving upward, and you decide to purchase an asset, be it a
currency pair or a stock. At the same time, you understand that you can run
into losses, because you do not know for sure when a reversal will occur and
the price will start to move downward, making your investment unjustified.
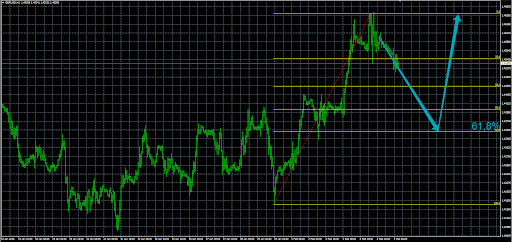
It is in
order to find the best moment to enter the market that the Fibonacci indicator
is used. With its help, you can determine how much the price has decreased against
the main trend in percentage terms.
According
to statistics, you can achieve the greatest trade efficiency entering the
market when the price touched levels of 23.6%, 38.2%, and 50%.
An
unusual way of using the Fibonacci levels
Most often,
this indicator is used to determine the correct time to enter a trade. Some use
the tool to determine where to set their profit and stop loss. In this case,
the principle remains the same, and the points themselves are considered the
most favorable levels when forming trade boundaries.
Remember
about the shortcomings
Any
technical analysis tool allows anyone to make one’s own purely subjective judgment on the situation. Seeing the
same chart, each trader creates one’s own strategies and comes to different
conclusions. The minimum and maximum points can be set at different levels,
especially when working with long-term trends.
In addition,
it should be noted that it is pointless to use this tool without other
indicators since you will not be able to objectively assess what is happening in
the market. Fibonacci levels help only to determine a trend retracement, and you
will need much more information is needed to increase the probability of a
trade being successful.

Use of this site constitutes acceptance of this user agreement.
All rights reserved © 2017-2026
algofxpro.com